


Plotting the Growth of Fusion Charts
- BY Sonal Khetarpal
 In Blog
 14813
14813 0
0
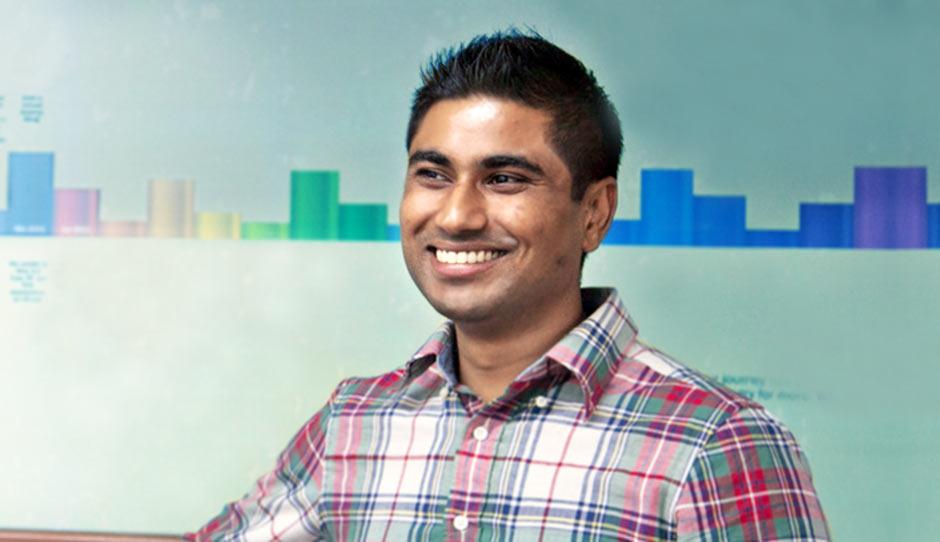
Few founders we meet are as refreshingly honest as Pallav Nadhani, the 29-year-old founder-CEO of FusionCharts, a software provider of data visualisation products. Nadhani is rare in his brutal assessment of the early blunders made while building his Kolkata-based company. “I was a kue ka maindak,” he says frankly as he recalls how he tried to establish a company without a sales team or business processes; even admitting to firing people without much thought. That’s a long list of blunders yet his company, that he founded when he was 17, has plotted quite a success. They earn Rs48-crores annually now, and have 23,000 customers across 118 countries, including the US Federal Government, Facebook, LinkedIn and Google, all of which use FusionCharts’ software products. Unsurprisingly, it isn’t a story without dramatic twists and turns, including a time when the company could have gone off the radar after Apple announced it wouldn’t support Flash (the prgramme FusionCharts used to build its products) on the iPad. Nadhani navigates us through his journey, a 12-year-old trek that he says should have taken five years.
I wasn't really thinking proactively, or long term in the sense of how to build a company.
Early Years
When I was in Class X1, a new bowling alley opened next to my school in Kolkata. This was in the year 2001 and I was 16 years old. I was soon hooked to bowling but an evening of bowling meant rolling out of Rs.1,000. That was my pocket money for an entire month! My parents obviously didn’t support my expensive hobby. I didn’t want to give up bowling so I started thinking about how I could make some money.
Fortunately, I came across ASPToday.com, a computer developers’ site where you could write an article for an innovative software idea and the site would pay $1,500. That was a lot of money. I wrote an article in Class XI on a file uploader for websites and got the money. It was easy and I started thinking of different ideas for coding.
 Nadhani's early business decisions were impulsive. Fixing these one at a time, has helped him take the company he founded at 17 to a Rs48 Crore turnover.
 At that time, we were taught MS Excel in school and I hated the idea of making charts and bar graphs on it. It was boring and so old-school especially because I knew a little bit about programming and web design then. My father owned a computer training centre when I was in primary school and later shut that down to open a web design company. Growing up, there were always a lot of computer books at home from which I picked up computer programming and website design. I went to his office frequently as well to help him build websites for local clients such as exporters and traders. Working on website design was such a pleasure. It was visual and interactive. It got me thinking—wouldn’t it be great if we could use Flash to make animated charts for web applications. I started working on this code and got it published in 2002. I was in Class 12 then.
I got a lot of positive feedback for my second article. Around 70-80 people wrote back to me in appreciation. I began to think that if so many people were interested in my code, I might as well build a product out of it. I took a subdomain under my father’s website design company, InfoSoft Global—since it was cheaper than buying a new domain—and made a website to document what the product could do. These were mostly very elementary sales and marketing charts. That paper, although very basic, became the pivot on which FusionCharts was built.
I sent this link to all the people who had sent me feedback. Almost a dozen replied back asking to buy the product. I didn’t even know I could ask for payment then. I quickly priced the basic software at $15 and the advanced one at $35. None of this was strategised. I wasn’t really thinking pro-actively, or thinking long term in the sense of how to build a company. It was more like, ok, this is the next logical step so let’s see how it works. I happily started selling the software online but I didn’t know how to receive payments from my customers, most of whom were in the US. I asked my customers to pay by cheque and made losses in the first few transactions because the amount I paid for processing the cheques was a lot more than the sales amount. I soon found a US company that would process payments and take 25 per cent of the sales amount as commission.
Profitable, by Chance

My father could see the business potential of selling the data visualisation software but insisted I finish my graduation first. Due to his persistence, I joined Bachelors in Computer Application from The University of Calcutta but dropped out on the third day itself. The syllabus was outdated and I knew most of it already. I moved to an Economics degree but even here dragged myself for one year. Soon, I dropped out of that too. Economics wasn’t my calling. I then moved to a Bachelors of Commerce degree for the simple reason that there was no need to attend classes. It was perfect for me as I could spend the whole day developing my software and study only near the exams. Also, the subject, at least, taught me a few things about company accounts.
Throughout my college years, I worked alone from home. I didn’t even try to speak to my customers, or get their feedback. I focussed completely on developing the product. Another thing I concentrated on doing was to promote sales using content marketing. I wrote about FusionCharts in various computer developer blogs, websites and forums. This strategy worked because all my customers were from the US, UK and Canada. They would buy online. As I graduated in 2005, I had 5,000 customers and a sales revenue of Rs4 crore.
I needed people to take care of customer feedback, admin work and banking regulations so I could concentrate on coding. In 2005, I moved to a garage style office in the basement of a residential building in Kolkata and started hiring. But, there was a major problem. Kolkata didn’t have good professional colleges so there was a big talent crunch. Worse, in Kolkata, people don’t trust their employers. They see business as an evil activity, a necessary evil but an evil all right.
 Throughout College, Nadhani worked from home. Away from everyone, including his customers.
 I was 22-years-old then and driven purely by gut. The simple rule I followed was—I have to make the product better and whatever helped me achieve that would become the norm in the company. We didn’t have any HR policies, formal dress code or official work timings. The focus was completely on performance and delivery. I remember firing a guy on New Year’s Eve once. I didn’t even think about how he would feel, or the demoralising effect it would have on rest of the team. To me, the logic was simple—he was not performing so he should not work with us. I did get negative feedback from some team members later on and only then began to understand the importance of human emotions while taking such decisions. By the end of 2006, I had built a 20 people team in our Kolkata office.
In 2007, I went to UK for Masters in Computer Science from the University of Edinburgh. That one year in university in the UK was a complete eye opener. There was no spoon-feeding, no one to check attendance or ask for homework. Students came to class because they wanted to learn. I got the exposure I direly needed. I realised that in Kolkata I didn’t even know what I didn’t know and that I was running the company like a kue ka mendak (frog in the well) for all these years.
When I came back to India, I started taking part in trade shows every two-three months. I understood that sales growth wasn’t the only metric to consider. I had to build the company too. I took part in the NASSCOM mentorship programme which was a great learning experience. It taught me how important it is to build a company around the product and not just work on increasing the product sales.
I remember firing a guy on New Year’s Eve once. I didn’t even think about how he would feel, or the demoralising effect it would have on rest of the team.
Business picked up as well. Apart from online, I also started selling through channel partners to expand our reach in global markets. That move worked very well for us and we got 10,000 customers by the end of 2008, including from non-English speaking countries such as South Korea. Our biggest moment though undoubtedly came in 2008 when we found out that the US government had used FusionCharts for its new federal IT dashboard. The dashboards were designed to give the public a look at the thousands of IT projects undertaken by federal government. Because we didn’t really have a sales team even then, we wouldn’t really track who our customers were. Unless somebody wrote to us with a complaint or a testimonial, we didn’t know who had bought our product. I accidentally stumbled upon President Barack Obama’s photo of inaugurating the site on a newspaper, and realised that they were using our product! We made this news an integral part of our online marketing plan and posted about it on different websites and forums. That increased our brand value in our community. By the end of 2009, the number of our customers shot up to 15,000.
The (almost) Breakdown
The fame didn’t last very long. Apple released its first iPad in April 2010, and Steve Jobs decided that it will support JavaScript and not Flash. All our products were built on Flash. We started getting a lot of complaints because our product didn’t support the new technology. With this decision, Steve Jobs wiped out all the work we had done in eight years. With the launch of the first iPhone (that also didn’t support Flash) in 2007, we should have anticipated the change in technology trends but unfortunately we didn’t think ahead. Now, there was no way we could replicate our products on JavaScripts in a few months—we didn’t have talent within the company to code in Java. Things went downhill for us. Even as we were building a new team, we had to now develop products from scratch. Our sales slowed down. To be honest, I could literally see FusionCharts die in front of my eyes.

The only option we had was to partner with one of the companies that already had built data visualisation products based on JavaScript and integrate it with our own software. That was the only practical, fast way to stay at par with this technological change. We came across a fairly new company that offered these JavaScript based products and partnered with them. We got into an exclusive licence with them to use their products for our own software. We paid a very hefty amount for this contract as not many companies were using JavaScript then in India. But we didn’t really have much of a choice.
Although very expensive, this partnership helped us overtake the competition completely as other data visualisation companies were still grappling with the same problem. It also gave us two years of time to build our technology and salvage the situation. This was a very tough decision though as I had to shake hands with my competitor. But, I thought it’s better to lower my ego and accept what I can’t do. The amount we paid them was negligible when compared to the value we earned eventually.
Building the New Graph
This partnership with our competitor got me two years of time to concentrate on the internal processes of the organisation. The first thing I did was move our office to Salt Lake, the commercial hub of Kolkata so we could hire more people. But, I couldn’t find the right people there nor was there an ecosystem to learn from so I decided to open another office in Bangalore in June 2011.
The main aim behind opening an office in Bangalore was to form the middle management team. We didn’t have any in Kolkata. Initially I hired a VP, Sales. He had 25 years of experience but he left after two months. For him, sales meant wining and dining clients. That didn’t work for us since ours is a volume-driven business. On my part also, I didn’t know what to expect from him. I then hired a fresher. He too left after six months. But as I hired (though the wrong people) and read autobiographies of successful entrepreneurs, I understood sales is not only about people but is a process that starts from identifying customers to nurturing them and ensuring their success.

During 2010 to 2013, I spent a lot of time working to build processes in FusionCharts, and make it a metrics-driven company. It was important to have an organisation where people took full responsibility and ownership of their roles. This would help ensure that work is always in progress even when I am not there. Before 2010, 90 per cent of the code was handwritten by me. If I was not present, it meant no product innovation would happen. Now since we have all the processes and teams in place, there is constant innovation and product development. For a technology company, the main challenge is to stay ahead of technology. We don’t want to make that mistake of lagging behind again. Our first move in this direction was the launch of two new products this year—RazorFlow, a framework that helps create cross-platform and cross-device dashboards and the latest version of Collabion, a product that lets business users build customisable dashboards in SharePoint. We released the first version of Collabion in 2012 and users have been increasing by 250 per cent year on year. We are now a Rs48-crore company with 23,000 clients and around 70 people across two offices.
Many say that FusionCharts is a 12-year-old company but I feel that it is only four-year-old. Before that, it was only a product; a product that sold well certainly, but it wasn’t a company. Now with all the processes and teams in place, we are looking to reach to 50,000 customers by opening offices in US and China in the next two years.


Add new comment